
What Is LPO? Landing Page Optimization Explained: Meaning, Process, and Fixes
- lpo
- cro
- landing-page
- beginners
Summary of this article
- LPO stands for Landing Page Optimization: improving the first page visitors see so a higher share of them sign up or buy
- With the same marketing spend and the same number of visits, a change in the LP's conversion rate changes both the number of results and the cost per result
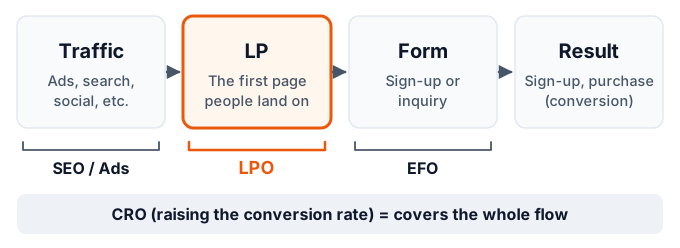
- SEO and ads "bring people in," LPO "gets the people you brought in to act," and EFO "keeps people from abandoning the input form." CRO is the improvement of the whole flow, including all of these
- The process is a repeating cycle of know the current state → find issues → form a hypothesis → fix → verify. Decide where to fix with data, not gut feeling
- The order to review: first view, match between ad and page, sign-up button, proof, reassurance, page speed and mobile display
- To check whether a fix actually worked, compare under equal conditions, such as with an A/B test
"We're getting ad clicks, but sign-ups aren't increasing." "We have traffic, but it isn't turning into inquiries." Most people who work on web acquisition run into this sooner or later. You can improve your traffic numbers, but if visitors don't act, results don't grow.
LPO is the practice of improving this "getting visitors to act" part. In this article, we cover, in order: what LPO is, why it matters, how it differs from SEO, EFO, and CRO, the basic structure of an LP, why LPs underperform, how to improve one step by step and what to fix, how to check that it worked, common mistakes, and the tools you'll use.
What Is LPO?
LPO stands for Landing Page Optimization. It is the practice of improving the first page people see after arriving from ads, search results, social media, and so on, so that a higher share of them take the intended action, such as signing up, buying, or making an inquiry.
"Optimization" here doesn't mean rebuilding a page once and calling it done. It means repeating a cycle of improvement: look at the data to find issues, form a hypothesis and fix the page, and then check the effect. LPO is closer to an ongoing improvement operation that includes verification than to a design job.
What Is an LP (Landing Page)?
LP (landing page) originally means "the page a visitor first lands on." In this sense, a blog post someone reaches directly from search and your homepage are both an LP for that visitor.
In day-to-day marketing, though, the term is often used in a narrower sense: a long, single page built to lead visitors from ads or similar sources to a sign-up or purchase. It typically has fewer links to other pages and focuses on one product or service and one action.
| Meaning | Pages it covers | Examples |
|---|---|---|
| Broad | Any page a visitor first sees | A blog post reached from search, the homepage, a product page |
| Narrow | A dedicated page built to lead to one action | A sign-up page for ads, a brochure request page, a campaign page |
LPO applies to both kinds of LP. However, results tend to show up more clearly in the numbers, and the work is easier to start, with the narrow kind (pages built as the destination for ads and similar sources). This article mainly assumes that kind.
What LPO Aims For
The goal of LPO is to raise the share of visitors who take the intended action. This share is called the CVR (conversion rate). A conversion is the action you want people to take on the page: a sign-up, purchase, brochure request, inquiry, and so on.
For example, if 1,000 people visit a page and 10 sign up, its CVR is 1%. If 20 of the same 1,000 sign up, the CVR is 2%. LPO is the work of raising this rate.
Why LPO Matters
LPO gets attention because it can increase results at a lower cost than increasing traffic.
When you want to double results from ads, the first idea is to raise the ad budget and double the visits. But ad costs rise in proportion to visits, and if the search terms or placements you're targeting are limited, spending more doesn't necessarily raise visits at the same rate.
If the LP's result rate goes up, on the other hand, you get more results with the same ad spend and the same visits. With more results, the cost per result (CPA: cost per acquisition) goes down.
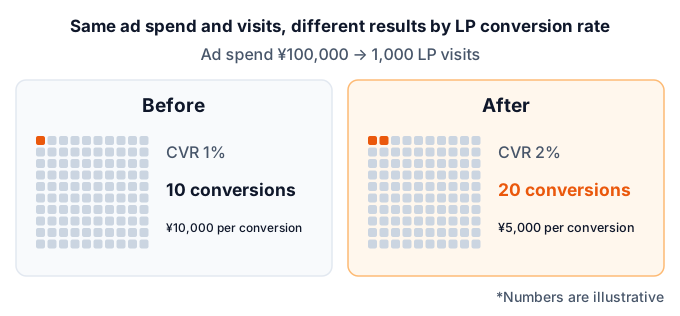
The figure above is an example to show how the numbers relate. How much the result rate actually rises depends heavily on the state of the page and the product, and there is no standard benchmark. Even so, the fact that the result rate and the cost per result move in inverse proportion holds for every site.
Needed to Make the Most of Better Traffic
LPO doesn't compete with acquisition work. Rather, it's needed to make the most of what acquisition brings in.
Even if you improve your ad copy or search rankings and get more visits, if the page they land on doesn't meet expectations, most of the added visitors will leave without converting. Acquisition and LP improvements are a pair: results grow only when both are in place.
It Also Affects Ad Evaluation
In Google Ads, "landing page experience" is one of the factors used to judge ad quality. It assesses whether the page content is relevant and useful to the person who clicked the ad. If the ad and the page don't match, it can affect how the ad itself is evaluated, so improving the LP matters from the ad-management side too.
How LPO Differs from SEO, EFO, and CRO
SEO, EFO, and CRO are terms similar to LPO. All of them are efforts to improve a website's results, but the place you improve differs.
| Term | Full name | Where you improve | Main goal |
|---|---|---|---|
| SEO | Search Engine Optimization | Search results | Increase visits from search |
| LPO | Landing Page Optimization | The first page people land on | Get visitors to act |
| EFO | Entry Form Optimization | Sign-up and inquiry forms | Keep people from abandoning mid-form |
| CRO | Conversion Rate Optimization | The whole flow to a result | Raise the share who reach a result |
How It Differs from SEO
SEO is the practice of ranking higher in search results to increase visits from search. LPO targets "people who have arrived," while SEO targets "people before they arrive."
The two are connected. An article or page that gets many visits from search is itself an LP. Reviewing whether it gives searchers the answer they want right away and guides them naturally to the next action is exactly the LPO mindset.
How It Differs from EFO
EFO is the practice of improving sign-up and inquiry forms to reduce the number of people who abandon them partway through. The main measures are things like cutting the number of fields, flagging input errors on the spot, and making required fields clear.
LPO covers "up to reaching the form," while EFO covers "from entering the form to submitting it." When the form is embedded in the LP, the line between the two blurs.
How It Differs from CRO
CRO is the broadest term, covering all efforts to raise the conversion rate. It covers the whole flow to a result: not just the LP but also product pages, the cart, pricing pages, forms, and even navigation within the site.
You can think of LPO as the part of CRO that focuses on "the first page people land on." Another difference: overseas, the term CRO is more common, while in Japan it's common to use separate terms by location, such as LPO and EFO.
Key Metrics for LPO
LPO uses metrics like the following. For each one, it's important to be clear about what you're looking at it for.
| Metric | Meaning | What it tells you |
|---|---|---|
| CVR (conversion rate) | Share of visits that led to a result | The LP's ultimate result. The number LPO ultimately wants to raise |
| CPA (cost per acquisition) | Cost per result | Cost-effectiveness combining ad spend and result rate |
| Bounce rate / engagement rate | Share who left after one page / share who had a meaningful visit | Whether the first view grabs interest |
| Scroll depth | Share of people who read down to a given point on the page | Where people stop reading |
| Button click rate | Share who clicked the sign-up button or similar | Whether people stall right before acting |
Separate Final Metrics from Intermediate Metrics
What you use to judge LPO in the end is metrics tied directly to results, such as CVR and CPA. Bounce rate and scroll depth are intermediate metrics you use to find where in the page a problem might be.
Chasing only intermediate metrics can lead you astray. For example, if you make the first view flashier and the bounce rate drops but sign-ups don't increase, results haven't improved. Conversely, you might shorten the page and raise scroll depth, yet sign-ups fall because the explanation is now insufficient.
Basic LP Structure
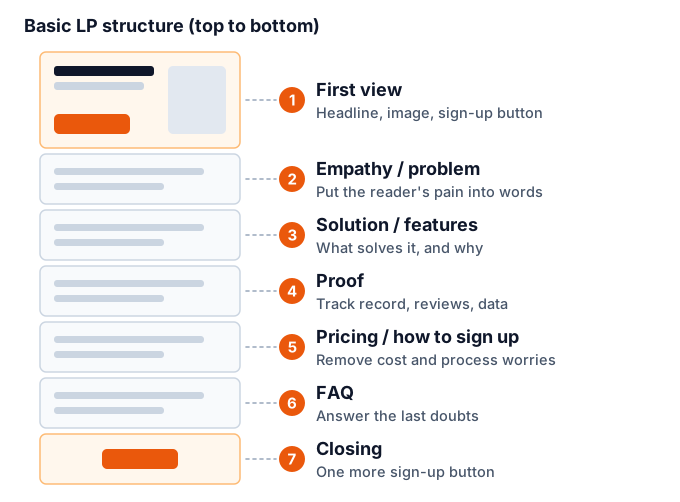
Before you start LPO, it helps to understand what parts a typical LP is built from, because it makes it easier to pinpoint where the problem is. It varies by product, but most LPs are organized in roughly this flow.
First View
The first view is the area visible first when the page opens, without scrolling. It usually holds the headline, a supporting sentence, the main image, a sign-up button, and so on.
Most visitors look at the first view to decide "whether to keep reading this page." If they don't feel "this is relevant to me" or "this is what I was looking for" here, they won't read what comes next. It's the block with the biggest impact in an LP.
Empathy and Problem
This block puts the reader's worries and frustrations into words. It often takes the form of a question like "Are you struggling with ...?" It gives readers the feeling that "this is about me" and a reason to keep reading.
Solution and Features
This block explains how and why the product or service can solve that problem. The key is not to list features but to convey how the reader's situation changes because of them.
Proof
This block shows the material that makes people believe the explanation. It includes track record, customer testimonials, third-party evaluations, data, media coverage, and so on. If claim after claim comes with no proof, readers keep reading with doubt.
Pricing and How to Sign Up
This block shows the cost and the steps from signing up to starting to use the product. Not knowing "how much will it cost?" or "what happens after I sign up?" is a major reason people hesitate to act.
FAQ
This block answers the questions and concerns that tend to come up right before signing up. Include what people often ask in inquiries, such as how to cancel, payment methods, and the scope of support.
Closing
This block briefly sums up the content at the end of the page and places the sign-up button once more. It lets people who read to the bottom act without scrolling back up.
This structure is only a general template. A low-priced product people can decide on quickly can do with a shorter page, while an expensive product that takes time to consider needs more proof and comparison information. The goal is not to fit the template but to answer the reader's questions in order.
Common Reasons an LP Doesn't Produce Results
The reasons an LP doesn't produce results vary by page. But the common ones are fairly predictable. Before improving anything, checking whether any of the following apply makes it easier to get a sense of the problem.
The Visitor's Expectation and the Page Content Don't Match
When what visitors saw in the ad or search result differs from what they see when the page opens, they feel "this isn't what I was looking for" and leave. For example, the ad emphasizes low price, but the page only talks about advanced features. This is one of the most common causes of an LP that doesn't produce results.
It's Not Immediately Clear What the Page Is
The first view has only an abstract headline or a mood image, and it isn't clear at a glance what is offered or who it's for. Readers decide within seconds, so a page that makes them hunt for the explanation is at a disadvantage.
It's Not Clear What to Do Next
The sign-up button doesn't stand out, appears only far down the page, or has wording like "Submit" or "Here" that doesn't say what will happen. Even if someone wants to act, they won't convert if they can't find where to do it.
Not Enough Reasons to Believe
Claims are made, but there isn't enough track record, customer testimonials, or concrete explanation to back them up. For lesser-known products and services in particular, a lack of proof is a major reason people hesitate to act.
Concerns Aren't Resolved
The page has no answers to the things people wonder about before signing up: pricing, contract lock-in, how to cancel, how personal data is handled. When something is unclear, readers tend to decide "I'll hold off for now."
Slow to Load or Hard to Use on Mobile
The page takes a long time to display, the text is small on a phone, the buttons are hard to tap, or images spill off the screen. Many people who arrive from ads are on mobile, so this is an easy cause to miss if you only check on a computer screen.
The LPO Process: 5 Steps
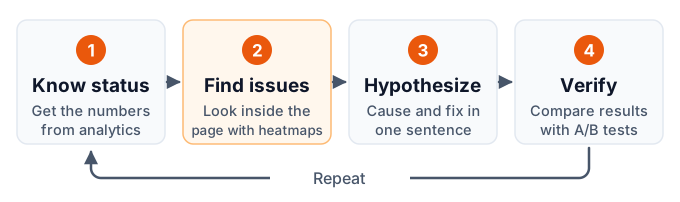
LPO runs by repeating the flow of know the current state → find issues → form a hypothesis → fix → verify. The basic rule is not to fix whatever comes to mind but to decide where to fix with data.
Know the Current State
In your web analytics, check the LP's visits, results, and result rate, broken down by traffic source and device. These numbers become the baseline for comparing the effect of improvements, so record them over a consistent period.
Find Issues
Using a heatmap or similar, check where in the page people stop reading and which places are or aren't being clicked. If the numbers show a traffic source or device with a problem, narrow your focus to it.
Form a Hypothesis
For the issue you found, put "why it's happening" and "how fixing it should improve things" into a single sentence. If you end up with several hypotheses, prioritize them by size of impact and ease of fixing.
Fix
Change the page, starting from the highest-priority hypothesis. If you change many places at once, you can't tell which change worked, so limit each round of changes.
Verify
Check whether the change raised the result rate by comparing under equal conditions. Keep the changes that helped, revert the ones that didn't, and record the results. Then go back to finding the next issue.
Next, we look at what to do in each step in more detail.
Know the Current State: The Numbers in Web Analytics
First, get a numeric picture of the LP's current state in a web analytics tool such as GA4. The numbers you capture here become the baseline when you judge the effect of improvements.
Look at the Result Rate by Traffic Source and Device
The LP's overall result rate alone doesn't tell you where the problem is. Looking at it split by traffic source (ads, search, social, and so on) and device (computer, mobile) reveals where the problem is.
- Only people from a particular ad have a low result rate → the ad's content may not match the page's content
- Only mobile has a low result rate → there may be a problem with how the page displays or works on mobile
- People from search have a high bounce rate → the searcher's intent may not match the page content
Look at the Stages Leading to a Result
When people go from the LP through a form to sign up, check the number of people at each stage: "people who viewed the LP," "people who went on to the form," and "people who completed the sign-up." Where the biggest drop is tells you whether the place to improve is the LP or the form.
Decide on a Baseline Period
The result rate fluctuates with the day of the week, the start and end of the month, the season, ad delivery conditions, and so on. So that you're not unsure when comparing, record a baseline period (for example, the last four weeks) and the numbers for that period.
Find Issues: Look Inside the Page with a Heatmap
Web analytics tells you "which LP" and "which traffic source" has a low result rate, but it doesn't tell you where in the page the problem is. That's where a heatmap comes in.
A heatmap is a method that aggregates visitor behavior on a page (clicks, scrolling, reading time, and so on) and overlays it on the page itself in shades of color. For how they work and the types, see What Is a Heatmap?. In LPO, you mainly look from the following angles.
Scroll: Where People Stop Reading
At each position on the page, check what share of people read down to it. On an LP, you especially want to check these two points.
- How many people leave right after the first view. If there's a big drop here, the first view may not be meeting expectations
- What share reach key information, such as the sign-up button and pricing. If few people reach it, you need to review where the information sits and the content before it
If there's a place where the reach rate suddenly drops, check whether just before it there is "white space that makes the page look like it has ended" or "a long explanation that kills the urge to read."
Click: Is Behavior Different from What You Expected
Check which parts of the page are being clicked.
- The sign-up button is clicked less than expected
- Images or headings that aren't links are clicked repeatedly (people think they can be clicked)
- People are leaving for other pages through links in the middle of the page
Clicks on things that can't be clicked can also be a clue that visitors want to know more about that part.
Attention: What Gets Read
Check which parts of the page stayed in view the longest. Look for whether explanations you worked hard on are being skipped, or conversely whether parts you didn't expect are being read closely.
Combine It with Other Clues
Behavior data alone can't tell you "why people acted that way." Combining it with clues like the following improves the accuracy of your hypotheses.
- Inquiry and sales records: Questions often asked before signing up are candidates for doubts the page doesn't answer
- Surveys: Ask on the page or after sign-up where people hesitated and what made them decide
- User testing: Have people who don't know the background look at the page and tell you where they got lost and which words were unclear
- Ad search terms: Check what visitors actually searched for before clicking the ad, to confirm their intent
Form a Hypothesis: Put the Cause and the Fix into One Sentence
When you find an issue, don't fix the page right away. Form a hypothesis first. A hypothesis is a sentence that states, in a form you can test, "why the problem is happening" and "how fixing it should improve things."
A good hypothesis includes these three elements.
- Observed fact: What the data showed
- Guess at the cause: Why you think it's happening
- Change and expected result: What you will change and which metric should change in what way
For example, it looks like this.
In the scroll heatmap, the reach rate drops sharply right after the first view (fact). The ad promotes "$0 setup fee," but that isn't visible in the first view, so visitors may feel they've landed on a different page and leave (guess at the cause). If we state the zero setup fee in the first-view headline, early exits should decrease and the result rate should rise (change and expected result).
Writing it this way lets you judge whether the hypothesis was right when the result of the change comes in. Even if the result differs from what you expected, you can look back at which guess was wrong, which leads to the next hypothesis.
How to Prioritize Hypotheses
When you have several hypotheses, prioritize them from these angles.
| Angle | What to consider |
|---|---|
| Size of impact | Do many people see that spot? Is it close to the result? |
| Strength of evidence | Do multiple pieces of data show the same trend? |
| Ease of fixing | Can it be done with a copy change, or does it need design or development? |
In general, you get results fastest if you start with something in a place many people see, such as the first view, where the evidence is clear and you can test it with a copy change.
LPO Improvement Points
From here, we go through concrete points for reviewing an LP, in the order they tend to have the biggest impact. You don't need to fix everything at once. Apply the ones related to the issues you found in the previous section.
First View: Say What the Page Is Right Away
What to check in the first view is whether who it's for, what it is, and how things get better come across within a few seconds.
- Does the headline describe the value offered specifically, rather than a mood?
- Is it clear who it's for (industry, size, problem, and so on)?
- Can you see the sign-up button, or a pointer to what to read next?
- Does the image convey what the product or service actually is, or how it looks in use?
On mobile, even less information fits in the first view. A first view built on a computer screen may leave the button out of sight on a phone, so always check both.
Match the Ad or Search Result to the Page
Visitors open the page expecting what they saw in the ad or search result. Whether that expectation matches the first impression when the page opens is the most basic point in LPO.
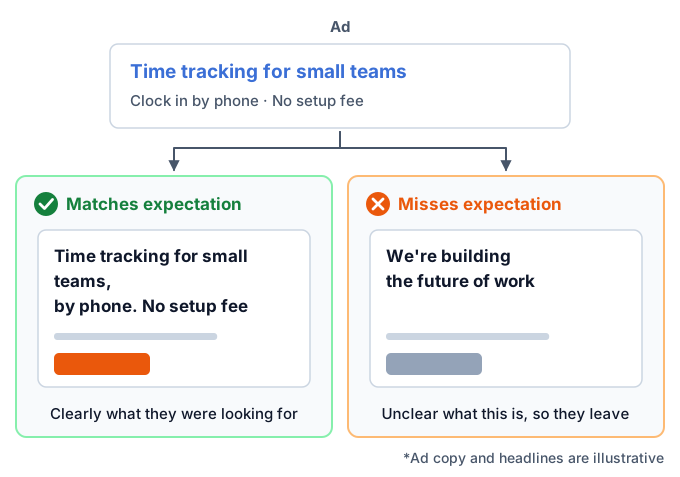
- Do the words the ad emphasized (price, features, target audience) also appear in the first view?
- Do the offers and conditions promised in the ad read the same on the page?
- If you run ads with several different appeals, do you have a page that fits each one?
If you send people from every ad to a single LP, the page tends to be half-hearted for every appeal. We cover how to split LPs by appeal in a later section.
Sign-Up Button: Easy to Find, and Clear About What Happens After
A sign-up button (CTA: Call To Action, an element that prompts action) needs to be something people who want to act can click without hesitation.
- Findability: Is it a color and size that stand out from its surroundings? Is it placed in the first view, at each break in the explanation, and at the end of the page?
- Wording: Rather than "Submit" or "Here," does it say what will happen when clicked, like "Get the brochure for free" or "Try free for 30 days"?
- Ease of clicking: Is it big enough to tap with a finger on mobile? Is it too close to other links?
- Worry after clicking: Is there a short line near the button, such as "No credit card required" or "Takes 1 minute," that lowers the barrier to acting (only when it's true)?
Proof: Show Material That Backs Up Your Claims
To make your explanation persuasive, place proof next to your claims.
- Track record and number of users (the numbers must be factual)
- Customer testimonials and case studies (they must be real; people trust them more when it's clear whose voice it is)
- Third-party evaluations, awards, certifications, media coverage
- Concrete screens or data showing features and effects
Avoid fabricated customer testimonials or numbers with no basis. Besides damaging trust, they may violate advertising and consumer-protection laws (such as Japan's Act against Unjustifiable Premiums and Misleading Representations). If you don't have much of a track record yet, rather than forcing numbers, choose material you can show honestly, such as how it works, the background of its development, or an explanation that lets people see who is behind it.
Resolve Concerns Ahead of Time
Right before signing up, list what readers are likely to worry about, and answer it within the page.
- The total price, and whether there are extra costs
- Contract-term lock-in and how to cancel
- The flow from sign-up to starting to use it, and how long it takes
- How personal data is handled
- What support includes and how to contact it
Questions you're asked repeatedly in inquiries are candidates for concerns the page doesn't answer. Put the answers in the FAQ block or near the pricing.
Match the Order and Amount of Information to the Product
Page length isn't a simple matter of shorter being better or longer being better. The right length changes with how much information readers need to make a decision.
- Low-priced, quick to decide → a shorter page focused on the key points
- High-priced, compared before deciding → a longer page with more proof, comparison, case studies, and FAQ
If the scroll heatmap shows many people leaving just before key information, candidates for review include reordering the information and cutting the lead-in.
Input Form: Don't Lose People at the Last Stage
If the LP has a form, or sends visitors on to a form, the form's usability also affects the result rate.
- Are the fields narrowed down to what's truly necessary?
- Are required and optional fields distinguished?
- Are input errors shown clearly before submission?
- Is it easy to fill in on mobile (for example, does a number field bring up a numeric keyboard)?
Form improvement is a deep field, deep enough that EFO has its own dedicated tools and methods. A good place to start is reviewing the number of fields and the required ones.
Page Speed: Don't Make People Wait
If a page loads slowly, people leave before they see the content. People who arrive from ads have only a weak reason to look at the page yet, so they often won't wait.
- Are images sized and formatted appropriately for the size they're displayed at?
- Are you overusing heavy videos, animations, or external components?
- Have measurement tags or ad tags piled up?
You can measure page speed with tools such as Google's PageSpeed Insights. For the time until the main content of the page appears (LCP), Google gives 2.5 seconds or less as a guide for "good." When you add a measurement tool, it's reassuring to compare page speed before and after installing it.
Readability on Mobile
On mobile, the screen is small and you operate it with a finger, so different problems arise than on a computer.
- Is the text too small, or are the lines too long?
- Is text inside images too small to read on mobile?
- Do tables or side-by-side elements spill out or break?
- Do parts fixed to the bottom of the screen cover the content or buttons?
We recommend going through the whole process once on an actual phone, from clicking the ad to completing the sign-up.
Show Guidance on the Page (Web Engagement)
Even without rebuilding the page itself, you can show an offer or notice with a popup or a bar fixed to the edge of the screen. This is called web engagement. Examples are showing an offer to someone about to leave the page, or showing a brochure request to someone viewing the pricing block.
Web engagement is easy to start, but done wrong it can get in the way of reading the content and backfire. Whether to show it and what to show should also be adjusted by verifying against the result rate. For the basics, see What Is Web Engagement?.
Verify: A/B Testing and Before/After Comparison
After you fix the page, check whether the change really raised the result rate. This is the most important step, the one that keeps LPO from being "fix it and forget it."
Limits of Before/After Comparison
The easiest approach is to compare the result rate in the period before the change with the period after. But this approach has limits, because the result rate also changes due to factors other than the page, such as the season, the day of the week, ad delivery conditions, competitor moves, and whether there's a sale.
Even if the result rate rose after the change, you can't tell whether it was the effect of the page change or just good timing. Conversely, you may have made a good change and still see no effect because of bad timing.
Compare with an A/B Test
An A/B test randomly splits the people who visit during the same period and shows them either the original page (A) or the changed page (B), then compares result rates. Because it compares the same period under the same conditions, it is less affected by factors other than the page, which makes it easier to isolate the effect of the change itself.
When judging with an A/B test, keep these points in mind.
- Wait until enough data has accumulated: While the numbers are small, chance differences show up large. Don't stop right away just because the gap opened up partway through
- Run it in whole-week units: Visitor tendencies differ by day of the week, so split periods in units of at least one week
- Change one idea at a time: If you put in several changes at once, you can't tell which worked
- Judge by the result metric: Judge by the result rate, not by intermediate metrics such as click rate
For how A/B testing works, the sample size you need, and how to judge a statistically meaningful difference, see What Is A/B Testing?.
When You Can't Run an A/B Test
Sometimes visits are too few to gather enough data to judge with an A/B test. In that case, you can raise the accuracy of your judgment with measures like these.
- Compare periods of the same length and the same mix of days of the week, before and after the change
- Record other changes during the period, such as ad delivery or sales
- Make each change bigger so the difference is easier to see when it works
- Also watch intermediate metrics close to the result (such as the rate of reaching the form)
These are not a substitute for an A/B test, though. Treat the result as "probably had an effect" and use it as material for the next improvement.
Record the Results and Move On to the Next Issue
Record the results of verification, both what worked and what didn't.
| What to record | Content |
|---|---|
| Hypothesis | Fact, guess at the cause, change and expected result |
| What changed | What you changed and how (keep screens from before and after) |
| Period and numbers | Compared period, visits, results, result rate |
| Decision | Adopted or not, and why |
| Next hypothesis | What to try next, based on the result |
As records pile up, you accumulate knowledge about "what works for this site's visitors," and the accuracy of your next hypotheses improves. Even when the person in charge changes, you avoid repeating the same mistakes.
Split LPs by Traffic Source
Once improvements are fairly advanced, consider splitting LPs by traffic source or appeal.
If you send all traffic to one LP, visitors' purposes and what they already know vary widely. For example, someone who searched by product name already knows the product and wants to know about pricing and how to sign up. Meanwhile, someone who searched with words describing their problem, or who happened to see a social ad, knows almost nothing about the product yet.
| Example traffic source | The visitor's state | What the LP should emphasize |
|---|---|---|
| Search by product or service name | Already knows it. At the compare-or-sign-up stage | Pricing, how to sign up, differences from others |
| Search by problem or goal words | Looking for a solution | Empathy with the problem, why it can be solved, proof |
| Social or display ads | Happened to see it. Interest is still weak | Value that's clear at a glance, an entry that draws interest |
| Email or existing customers | Has a relationship. Has some trust already | Offers and new information, a path to act right away |
Splitting LPs lets you show each visitor content that suits them, but it also means more pages to manage, with fewer visits to each, so verification takes longer. It's realistic to split starting with the traffic sources that have the most visits.
Common LPO Mistakes
Here are the mistakes often seen in LPO efforts, and how to deal with them.
Rebuilding Based on Design Preference
This is the case where people rebuild the whole page without looking at data, because it "looks outdated" or they "want it to look more stylish." The result rate may drop after the rebuild, and you won't know what caused it. First check with data where the problem is in the current page, then rebuild.
Changing Too Many Places at Once
If you change the first view, the button, the proof, and how pricing is shown all at the same time, then even if the result rate changes, you can't tell which change worked. Good and bad changes can also cancel each other out so that nothing seems to change. Limit your changes and check them one at a time.
Judging While the Numbers Are Still Small
This is the case where someone judges from a few days of data that "the result rate went up" and locks in the change. While the numbers are small, chance differences show up large. Wait until the numbers needed for a judgment have accumulated, or treat results judged on small numbers as provisional.
Judging by Intermediate Metrics Alone
This is the case where people decide something improved because the button click rate or bounce rate got better. As noted earlier, better intermediate metrics don't necessarily mean more results. Make the final judgment with result metrics.
Checking Only on a Computer Screen
If you do production and checking on a computer, it's easy to miss problems in how the page looks on mobile. If most people arriving from ads use mobile, prioritize checking the mobile result rate and how the page looks.
Looking Only at the Page, Not at Acquisition
Sometimes the reason an LP's result rate is low lies not in the page but on the acquisition side. If the ad targeting is too broad or the search terms don't match the intent, the result rate is unlikely to rise however much you fix the page. When the result rate is low, also check what kind of people are arriving.
Types of Tools for LPO
At each LPO step, you use tools like the following. You don't need to have them all. It's enough to start with the ones that fit your current problem.
| Tool type | Step used | What it tells you or lets you do | Examples |
|---|---|---|---|
| Web analytics | Know the current state | Visits and result rate by traffic source and device | GA4 |
| Heatmap | Find issues | Where on the page people read and click | Heatmap tools from various vendors |
| Session replay | Find issues | Recordings of individual visitors' actions | Tools with session recording |
| Surveys and user testing | Find issues, form a hypothesis | Why people hesitated, what made them decide | Survey tools, in-person or online research |
| A/B testing | Verify | Compare the pages before and after a change in the same period | A/B testing tools |
| Page building | Fix | Create and change the LP | CMS, LP builders |
| Page speed measurement | Fix, verify | Page speed and points to improve | PageSpeed Insights |
Heatmaps and A/B tests handle "finding issues" and "checking," the two central steps of LPO. For the difference between the two and when to use each, see Heatmaps vs. A/B Testing: The Difference and When to Use Each.
When choosing a heatmap tool, compare what you can use for free, how long data is kept, the impact on page speed, privacy considerations, and so on. A comparison of the major tools is in Best Heatmap Tools in 2026: Tested and Compared.
In-House or Outsourced?
You can do LPO in-house, or ask a production agency or consulting firm. Which suits you depends on your internal setup and how often you'll keep improving.
| Approach | Suited when | Watch out for |
|---|---|---|
| In-house | You can change pages in-house and want to repeat small improvements quickly | You need someone with analysis and verification knowledge. It's hard to notice the builder's assumptions |
| Outsource | No one in-house is in charge, and you want to borrow analysis or production expertise | It costs money. The improvement knowledge tends not to stay in-house |
| Combine | Analysis and big rebuilds outside, small day-to-day improvements in-house | Decide how to split roles and share data |
Even if you outsource, decide in-house what the goal is and which metrics you'll judge by. Also, having the data used and the verification records kept in-house makes it easier to keep improving after the engagement ends.
Getting started with HeatMapX
Finally, here are just the facts about our HeatMapX that relate to LPO (as of November 2026).
$0 Monthly price of the Free plan (no credit card required)
5,000 Sessions you can track on the Free plan (per month, 1 site)
About 7KB Size of the tracking tag (compressed)
- Heatmaps you can view: Three types: click, scroll, and mouse movement. You can switch between computer and mobile views and filter by device type
- Setup: Add one line of tracking tag. It also works with GTM, WordPress, Shopify, and more. For the steps using GTM, see How to Install a Heatmap with Google Tag Manager (No Code Edits, 5 Minutes)
- Privacy: The tracking tag doesn't use cookies and doesn't collect information that can identify individuals, such as names or email addresses
- Pricing: Flat-rate plans: Free ($0) / Lite ($12 per month) / Plus ($29 per month) / Pro ($99 per month). The heatmap features are the same on every plan. What changes is the number of sites you can register and the number of visits you can track per month
- Analysis with AI: You can connect an AI such as Claude and have it read the aggregated heatmap data
- A/B testing: Being rolled out gradually
We'll also be honest about use cases it isn't suited for. HeatMapX has no session replay (recordings of visitors' actions) or survey features. If you want to replay individual visitors' actions to find out why they hesitated, a tool with session replay is a better fit.
For the "find issues" step on an LP, we recommend starting with the scroll heatmap to check "what share reach the sign-up button," separately for computer and mobile. For plan details, see the pricing page.
Frequently Asked Questions (FAQ)
What Is LPO, in Simple Terms?
It's the practice of improving the first page (the LP) that visitors see from ads, search, and so on, to raise the share of people who take an action such as signing up or buying. Its formal name is Landing Page Optimization. You do it by repeating a cycle of using data to find issues, fixing them, and checking the effect.
Which Should I Do First, LPO or SEO?
If you already have a fair amount of traffic, LPO is worth considering first. Even if you increase visits, if the page's result rate stays low, the added visits are unlikely to turn into results. On the other hand, if you have almost no visits, you also can't collect enough data to check the effect of LPO. The usual order is to secure a certain amount of traffic through acquisition first, then raise the result rate with LPO.
What Is the Difference Between LPO and EFO?
The place you improve is different. LPO covers the whole first page people land on, improving things up to the point where visitors move on to the form or sign-up. EFO covers the input form, improving it so that people who start filling it in don't quit partway and can submit. If the LP has a form in it, you review both together.
How Long Does It Take for LPO to Show Results?
It depends on the page's visits and the size of the change, so there's no standard benchmark. For a page with a lot of visits, if you change a high-impact spot such as the first view, you may be able to judge within a few weeks. For a page with few visits, it takes time to collect the numbers needed for a judgment. For A/B tests, the basic rule is to run them in units of at least one week.
Can I Do LPO Without Tools?
You can start basic improvements with free web analytics alone. You can check the result rate by traffic source and device, and review the page. However, a heatmap greatly improves the accuracy of your judgment in finding where in the page the problem is, and an A/B testing tool does so in checking the effect of a change accurately. Some heatmaps are available for free.
Is a Long LP Better, or a Short One?
It depends on the product. For a low-priced product or service people can decide on quickly, a short page focused on the key points is a good fit. For a high-priced one that people compare before deciding, a long page with more proof, comparison, and FAQ is a good fit. Which is better is judged by checking how the page is read with a scroll heatmap and comparing with an A/B test.
Summary
LPO is the practice of improving the first page people see from ads, search, and so on, to raise the share who sign up or buy. Even with the same marketing spend and the same number of visits, if the result rate goes up, the number of results increases and the cost per result goes down.
Here are the key points of this article.
- The terms split by where you improve: SEO and ads are acquisition, LPO is the landing page, EFO is the input form, and CRO is the whole flow
- The process has five steps: know the current state → find issues → form a hypothesis → fix → verify, repeated
- Decide where to fix with data: use web analytics to find the traffic source and device with a problem, and a heatmap to find the problem spot within the page
- What to review: first view, match between ad and page, sign-up button, proof, reassurance, order of information, form, page speed, and readability on mobile
- Verify with result metrics: judge by the result rate, not intermediate metrics, and compare in the same period with an A/B test if you can
- Record the results: record the changes that didn't work too, and carry them into the next hypothesis
As a next step, pick one LP that is directly tied to results and use web analytics to check the result rate by traffic source and device. Then, narrowing down to the combinations with low result rates and looking at a heatmap will show you the first place to fix.
If you'd like to start with the basics of heatmaps, see What Is a Heatmap? as well.