
What Is a Heatmap? The 4 Types, How to Read Them, and How to Analyze Them: A Beginner's Guide
- heatmap
- cro
- how-to
- beginners
Summary of this article
- A heatmap is a method that overlays visitor behavior on a web page (clicks, scrolling, reading time, and mouse movement) as shades of color on the page itself
- There are four main types: click, scroll, attention (reading), and mouse movement. Each one answers a different question
- Web analytics tools such as GA4 tell you "which page" people leave. A heatmap tells you "where on the page" something happened
- Don't judge by color alone. Match data volume, device, and traffic source before you read a heatmap to avoid misreadings
- A heatmap is a tool for finding problems. To check whether a fix actually worked, verify it with something like an A/B test
- Many tools only need a single line of tracking code to set up, and several of them can be used for free
"When I look at our analytics, a lot of people leave on this page. But I can't tell what's wrong with it." Anyone who works on improving a website hits this wall sooner or later. The numbers tell you that people left, but not what visitors looked at on the page, where they got confused, or where they stopped reading.
A heatmap makes that "inside of the page" visible. In this article, we walk through what a heatmap is, how it works, the four types, how it differs from GA4, how to read one and common misreadings, how to approach improvements, how to choose a tool, how to set one up, and privacy considerations, in that order.
Note that the word "heatmap" can also refer to a table in Excel or a chart used in statistics or genetic analysis. This article covers website heatmaps (visualizations of visitor behavior in color). The third section explains how they differ from heatmaps in data visualization generally.
What Is a Heatmap?
A heatmap is a chart that represents the magnitude of values with shades of color. In the website world, the term refers to a display that aggregates the behavior of people who visit a page and overlays it as color on the actual page.
In most tools, places with a lot of activity are shown in warm colors such as red and orange, and places with little activity are shown in cool colors such as blue. Think of an image from a thermal camera (a camera that shows temperature as color). A website heatmap does the same thing, except that instead of temperature, the color represents "how many times something was clicked" or "how much it was read."
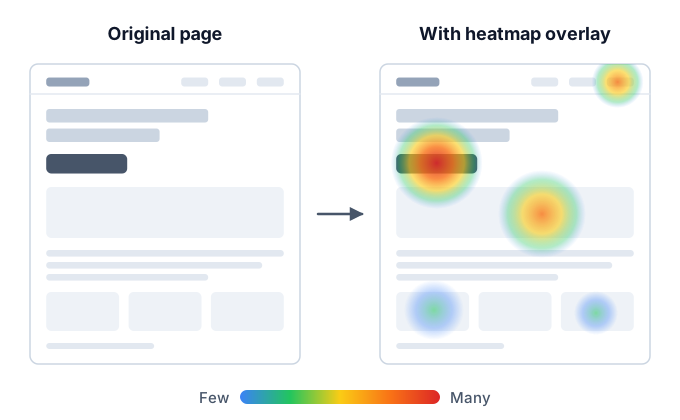
The value of a heatmap is that you can spot likely problem areas at a glance, without reading a table of numbers. For example, you can see things like these just by looking at the screen:
- The sign-up button isn't being clicked as much as you expected
- Images or headings that aren't links are being clicked again and again
- Most people don't look at anything below the middle of the page
- A paragraph of explanation that you worked hard on is being skipped
On the other hand, a heatmap doesn't tell you "why" something happened. The colors only show the result of behavior. The reasons are hypotheses that you need to form yourself by considering the page content and the traffic source. We cover this in detail in the "How to Read" and "Common Misreadings" sections later.
What Is a Heatmap Tool?
A heatmap tool is a service that records visitor behavior and displays it as a heatmap. Once you add a tracking tag (a short snippet that loads a small program) to your site, the tool collects behavior data and lets you view a heatmap for each page in its dashboard.
Some tools offer more than heatmaps, such as session replay (a feature that plays back each visitor's actions like a video), surveys, and A/B testing (a method of showing two versions and comparing the results).
What Is Heatmap Analysis?
Heatmap analysis is the series of tasks in which you read a heatmap, find problems on the page, and form hypotheses for improvement. The goal isn't to stare at the heatmap itself. Think of it as gathering the material you need to decide "what to fix, why, and how."
How Heatmaps Work
A heatmap is built in three broad stages: recording, aggregation, and overlay.
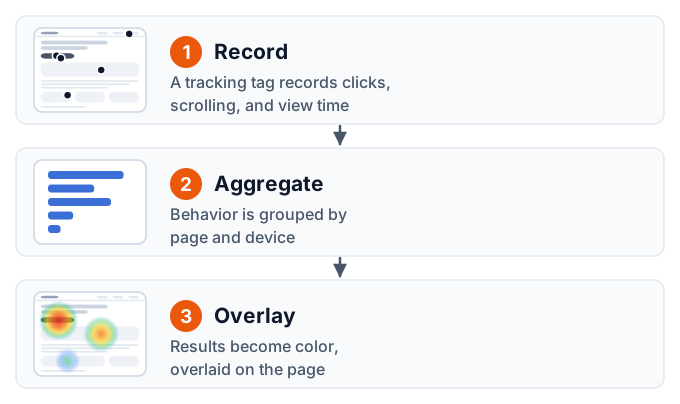
1. A Tracking Tag Records Behavior
The tracking tag you add to your site runs inside the visitor's browser and records behavior such as the following:
- Where they clicked (or tapped, on a phone)
- How far they scrolled down the page
- Which part of the screen was displayed, and for how long
- Where the mouse cursor moved and where it stopped
The recorded behavior is sent to the tool's server. Along with it, the tool generally also sends information used for filtering later, such as the page URL, screen size, and device type (desktop, phone, or tablet).
2. The Data Is Aggregated by Page and Device
The behavior data collected on the server is aggregated by page and by device. Because the same button can appear in a different position depending on screen width, many tools record and aggregate positions not as "pixels from the top left of the screen" but relative to the whole page or to the element that was clicked (a button or link).
3. The Result Is Overlaid as Color on the Page
Finally, the aggregated results are converted to color and overlaid on the page (either a screenshot taken by the tool or the actual rendered page). This produces a heatmap in which places with a lot of activity appear red and places with little appear blue.
How This Differs from Heatmaps in Data Visualization Generally
"Heatmap" is a term that originally comes from, and is widely used in, data visualization. A website heatmap applies the same idea to a web page. Because the two get mixed up in search results, here is how to tell them apart.
| Field | What "heatmap" means | What the color represents |
|---|---|---|
| Website improvement (this article) | A chart that overlays visitor behavior on a page | Click volume, reach rate, how much was read |
| Excel and spreadsheets | A table color-coded with conditional formatting (color scales) | The size of the number in each cell |
| Statistics and data analysis | A chart that colors combinations of rows and columns (such as a correlation matrix) | Values such as correlation coefficients or counts |
| Life sciences (such as genetic analysis) | A chart that lays out genes and samples in rows and columns | Measured values such as expression levels |
| Maps, weather, and similar | A chart that shows a distribution as color on a map | Density, such as population, temperature, or crowding |
What they all have in common is that they "represent the size of values with shades of color." What differs is what the color is laid over (a table, a map, or a web page) and what number the color represents.
If you are looking for how to color-code a table in Excel or how to draw a correlation matrix in statistics software, this article isn't what you need. From here on, we focus on website heatmaps.
The 4 Types of Heatmaps
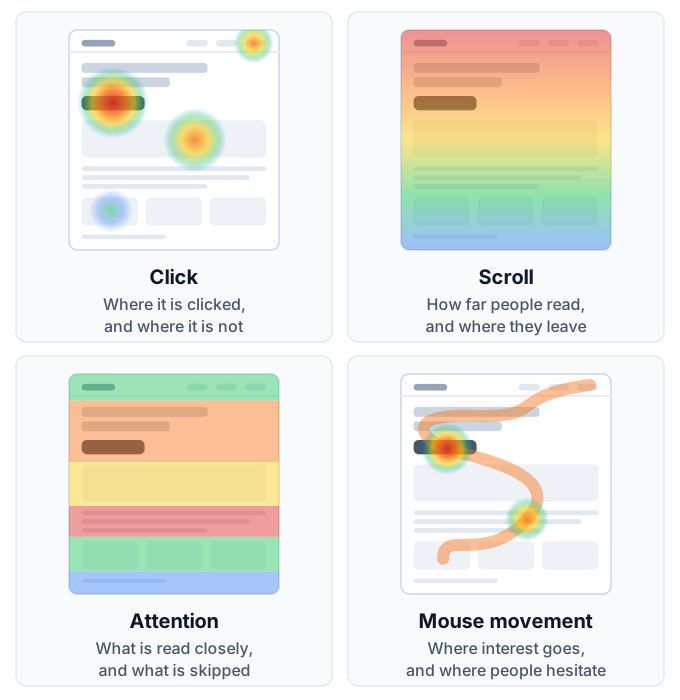
There are four main types of website heatmaps. Each answers a different question, so you choose between them depending on your goal.
| Type | Behavior recorded | Question it answers | Main use |
|---|---|---|---|
| Click heatmap | Where people click or tap | Where is it being clicked, and where isn't it | Reviewing buttons, links, and menus |
| Scroll heatmap | How far down the page was displayed | How far do people read, and where do they leave | Reviewing the order of information and page length |
| Attention heatmap (reading areas) | How long each part of the screen was displayed | Where do people read carefully, and where do they skip | Reviewing text and structure |
| Mouse movement heatmap | The path and resting points of the mouse cursor | Where is interest directed, and where are people hesitating | Supplementary checks for desktop pages |
The types supported and the names used differ from tool to tool. Some tools offer only clicks and scrolling, while others support all four types.
Click Heatmap
A click heatmap shows in color where on the page people clicked (or tapped). It's the most intuitive heatmap and the one you should look at first.
A click heatmap mainly tells you these three things:
- Whether the places you want clicked are being clicked: whether the sign-up or purchase button has color on it
- Whether places that can't be clicked are being clicked: if images, headings, or underlined text that aren't links are being clicked, visitors expect them to be clickable
- Whether attention is scattered: whether loosely related links are getting more clicks than your main button
The second point, clicks on things that can't be clicked, is hard to find with web analytics and is something only a heatmap can reveal. It leads directly to improvements such as turning a frequently clicked image into a link or letting it be enlarged.
Scroll Heatmap
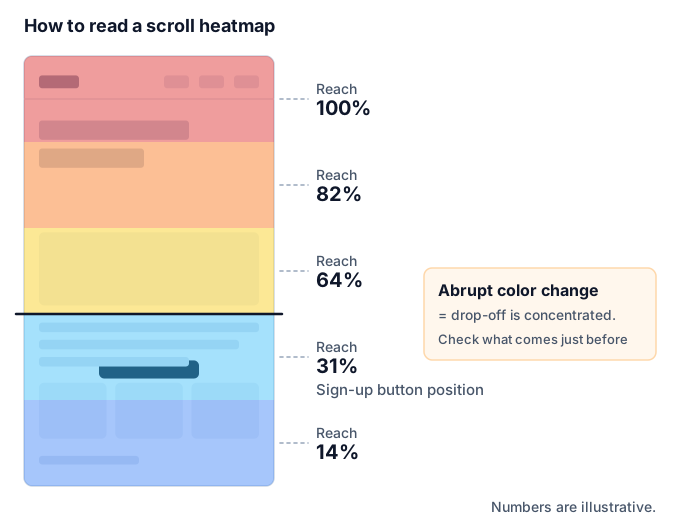
A scroll heatmap shows in color how far down the page, and what share of people, reached each point. The color changes from the top of the page to the bottom, and a place where the color changes abruptly is "where many people left."
A scroll heatmap tells you the following:
- Whether people read as far as the important information: what share of people reached the pricing table or the sign-up button
- Where drop-off is concentrated: there is likely to be a trigger for leaving just before the place where the color changes like a step
- Whether the page length is appropriate: if the lower part is barely seen, you can consider reordering or removing content
Where the color changes abruptly, there is often a design that makes people think "the page ends here" (a large blank space or a divider that looks like a footer). This kind of misleading divider is called a false bottom.
Attention Heatmap (Reading Areas)
An attention heatmap shows in color which parts of the page were displayed for a long time. The areas where visitors stopped scrolling and kept the content on screen turn redder, so it is sometimes called a "reading area" map.
While a scroll heatmap shows "whether people got there," an attention heatmap shows "whether they stopped there." A place that people reached but where the color is faint may have been skipped.
- Whether the paragraphs you want read are being read
- Whether unexpected places are being read closely (content that is read a lot is a candidate to move higher up)
- Which paragraphs are being skipped (candidates to cut, shorten, or give a different heading)
One caution: what an attention heatmap measures is "how long that area was displayed on screen." It does not measure the visitor's actual gaze. Time when someone left the screen open and walked away can get mixed in, so whether the tool excludes overly long stays is also a premise to keep in mind when you read it.
Mouse Movement Heatmap
A mouse movement heatmap shows in color where the mouse cursor passed and where it stopped. Some people keep the cursor near the text while reading, and others hold it over a button while deciding whether to click, so it is used as a clue to interest and hesitation.
However, the cursor position doesn't always match where someone is looking. Many people read with the cursor parked at the edge of the screen. Also, phones and tablets have no cursor, so a mouse movement heatmap covers only visits from desktop computers. It is reasonable to treat it as reference information that supplements the results of clicks and scrolling.
What Heatmaps Can and Can't Tell You
Heatmaps are useful, but they aren't all-purpose. Knowing in advance what they're good and bad at helps you avoid overconfident decisions.
What a heatmap can tell you
- Where behavior is concentrated on a page, and where it is ignored
- The position at which many people stop reading
- Gaps between what the creator expected and what people actually do (places you want clicked aren't, places that can't be clicked are)
- Differences in behavior between desktop and mobile
What a heatmap alone can't tell you
- The reason behind behavior: why someone didn't click or why they left isn't directly visible from the colors
- The flow across the whole site: which page someone came from and which page they went to next is the domain of web analytics
- The effect of a change: whether results improved after a fix has to be checked by comparing before and after, or with an A/B test
- Individual behavior: a heatmap is an aggregate. To follow individual actions you need session replay
In short, a heatmap is a tool for finding likely problem areas and forming hypotheses. It is good at "finding," but "confirming" has to be combined with other methods. We cover this division of roles as concrete steps in "How to Approach Improvements" later.
How Heatmaps Differ from Web Analytics Such as GA4
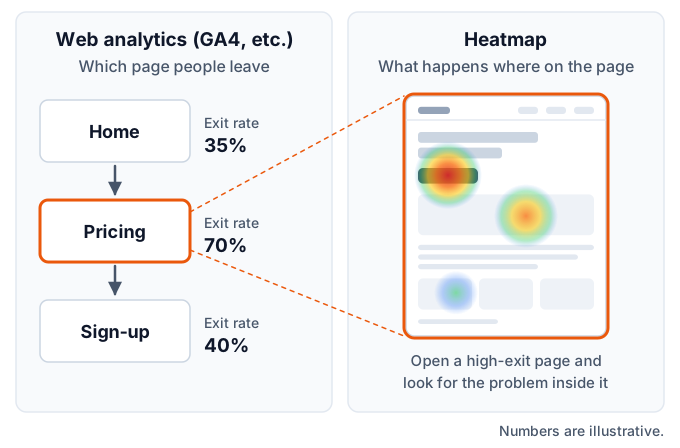
Heatmaps and web analytics tools such as GA4 (Google Analytics 4) look at different scopes. Web analytics is a tool for viewing the whole site in numbers, and a heatmap is a tool for viewing the inside of a single page on screen.
| Point of comparison | Web analytics (GA4, etc.) | Heatmap |
|---|---|---|
| Scope | The whole site and the flow between pages | The inside of a single page |
| Question it answers | On which pages, and how much, do people leave | Where on the page, and what, happened |
| Form of display | Numbers, tables, and graphs | Color overlaid on the page |
| Strengths | Comparing traffic sources, comparing pages, measuring results | Seeing where people click, what range was read, and where they drop off |
| Weaknesses | Understanding what happened inside a page | Aggregating site-wide trends and results |
| When to use | Deciding which page to improve | Deciding where on that page to fix |
With GA4, you can also measure scrolling or specific clicks as events, depending on how you configure it. But that counts "how many times a pre-defined behavior happened." Unexpected behavior, such as a non-link image being clicked, stays invisible unless you set up tracking for it in advance. A heatmap records behavior across the page and overlays it on the screen, so it is easier to notice unexpected behavior.
Use the Two in Order
Rather than asking which is better, it's more practical to think of an order in which to use them.
- Use web analytics to find pages that get a lot of visits but don't lead to results (this decides which page to fix)
- Look at that page's heatmap to find where on the page the problem might be (this decides where to fix)
- After fixing it, confirm with web analytics or an A/B test whether results changed
With web analytics alone, you get stuck on "where should I fix it?" With a heatmap alone, you don't know "which page to start with" or "whether the fix made things better." Only when you have both does the improvement flow connect.
The Basics of Reading a Heatmap
When you open a heatmap, going through it in the following order keeps you from getting lost.
First, Check the Data Conditions
Before you look at colors, check how many people's data this heatmap covers, from when, and for which device. In most tools, the collection period, the number of sessions (visits), and the device filter are shown at the top of the screen. If you look at colors without knowing the conditions, you have no basis for a decision.
Use Scrolling to Get the Overall Flow
Start with the scroll heatmap. Check how the share of people reaching each point drops from the top of the page to the bottom.
- Is there a big drop right after the first screen (the above-the-fold area)?
- Where does the color change like a step?
- What share reaches the position of important elements such as the sign-up button or the pricing table?
If you learn here that "many people don't even reach the important element," you can conclude that reviewing the order comes before adjusting the button's color or wording.
Use Clicks to Find Gaps in Behavior
Next, use the click heatmap to look for gaps between what the creator expected and what people actually do.
- Is the main button being clicked?
- When there are multiple buttons with the same role, which positions are being clicked?
- Are clicks gathering in places that aren't links?
- Is too much behavior flowing to places that lead off the page, such as menus and related links?
Supplement with Attention and Mouse Movement
Finally, use the attention heatmap and the mouse movement heatmap to check what content is being read and what is being skipped. This is a check to back up (or reconsider) the hypotheses you formed from scrolling and clicks, from a different angle.
Filter and Compare
After looking at the whole, narrow the conditions and compare. The following three cuts tend to show differences:
- Device: desktop and mobile differ in screen size and in how people operate the page
- Traffic source: people who arrive from an ad and people who arrive from search differ in purpose and prior knowledge
- New vs. returning visitors: first-time visitors and people who already know the site read different places
A heatmap that looks ordinary overall can show a problem clearly once you filter it.
Common Misreadings
Because heatmaps look intuitive, they have a weakness: it's easy to read them according to your own assumptions. Here are six common misreadings.
Judging with Too Little Data
On a page with few visits, the colors can change a lot because of a handful of people. A spot that one person happened to click many times can turn bright red. Extending the collection period and looking at pages with more visits first keep you from being swayed by a few people's behavior. How much data you need depends on the page and the goal, so a practical rule of thumb is to check whether the trend stays the same when you extend the period.
Mixing Devices
On desktop and mobile, the visible area, the button positions, and the way people operate the page all differ, even on the same page. A heatmap that mixes them doesn't accurately represent either one. The basic rule is to look at each device separately. Check the device with more visits first.
Deciding Good or Bad by Color Alone
Red doesn't always mean good, and blue doesn't always mean bad.
- A red sign-up button is desirable, but a red link that leads off the page may mean a lot of people are leaving
- A blue area like a disclaimer that not everyone needs to read is not a problem
- A heavily read explanation might mean high interest, or it might mean it's hard to understand and people are rereading it
Judge what the color means against the role of that place.
Confusing Proportions with Absolute Numbers
Heatmap colors usually show relative volume within that page. A spot that's bright red on a low-traffic page can actually have fewer clicks than a faintly colored spot on a high-traffic page. Along with the color, check the actual counts and percentages.
Ignoring Differences in Traffic Source or Period
Visitors' purposes differ between an ad campaign period and other times, or between a sale period and normal times, so behavior changes too. If you changed the page, aggregating data that mixes the periods before and after the change overlaps behavior on the old design with behavior on the new design. It's important to look at separate periods.
Not Noticing That the Screen and the Actual Display Are Out of Sync
A heatmap overlays color on a page screen captured at a certain point in time. If the page has been changed since then, or if there are elements whose display varies by visitor (such as slideshows, expanding menus, popups, or content shown after login), the color positions can drift away from the elements that were actually clicked. When clicks appear to gather where there is nothing, first suspect a mismatch in the screen.
How to Approach Improvements Using Heatmaps
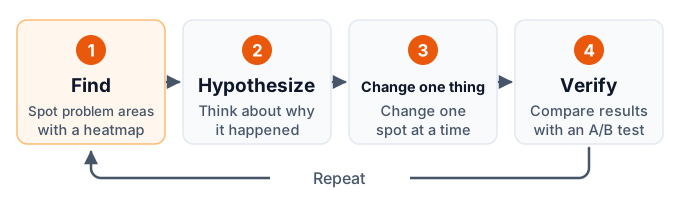
If you just look at a heatmap and stop, nothing changes. It leads to results only when you build it into the flow of find, form a hypothesis, change, and verify.
Decide which page to improve
Use web analytics to choose a page that gets a lot of visits and has a large impact on results (sign-ups, purchases, inquiries). If you start with a page that has few visits, it takes a long time for data to accumulate.
Find the problem areas with the heatmap
Look in the order scroll, click, and attention, and write down the gaps between what you expected and what actually happens. At this stage, don't think about how to fix it. Just record "what is happening."
Form a hypothesis
Think about the reason for the gap. Write the cause and the fix in a single sentence, such as "Few people reach the sign-up button, probably because the large blank space before it makes the page look like it has ended."
Change one thing at a time
Change the page according to your hypothesis. If you change many places at once, you can't tell which change worked, so keep the changes limited.
Verify
Check whether results changed before and after the change. If possible, use an A/B test to show the original page and the changed page during the same period and compare them.
Record the results and move on
Record both the changes that worked and the ones that didn't. Look at the heatmap again on the changed page and look for the next problem.
Why Verify with an A/B Test?
If you simply compare before and after a change, outside factors such as season, advertising, and day of the week get mixed in. Even if results are better than last month, you can't tell whether that's the effect of your change or just good timing.
An A/B test is a method that randomly splits visitors during the same period, shows them either the original page (A) or the changed page (B), and compares the results. Because the comparison is made under the same conditions, it is easier to isolate the effect of the change itself. The basics of the method are explained in What Is A/B Testing?.
If you can't run an A/B test right away, you can still improve the quality of your decision by comparing periods of the same length and the same mix of days of the week before and after the change, and by recording whether anything else changed, such as ads or sales.
Where to Use Them by Page Type
The points to look at in a heatmap change depending on the role of the page. Here are four representative types of pages.
LPs (Landing Pages)
An LP is a page that guides people who arrive from an ad or similar source to a sign-up or inquiry on a single page. They are long and vertical and have a clear role, so they are especially well suited to heatmaps.
- Scroll: how many people leave right after the above-the-fold area, and what share reaches the position of the sign-up button
- Click: of multiple sign-up buttons, which positions are being clicked, and whether images or headings that can't be clicked are being clicked
- Attention: which blocks are read, such as customer testimonials, pricing, and FAQs
This gives you material for improvements such as moving blocks that are read to the top, shortening blocks that aren't read, and adding a button at a position with a high reach rate. If you filter by traffic source for each ad and compare, you can also check whether the ad's message matches the page content.
Product Pages on E-commerce Sites
On a product page, visitors are looking for the information they need to decide whether to buy.
- Click: whether product images are being clicked (a sign that people want to enlarge them), and whether links to size charts, shipping, and return policies are being clicked
- Scroll: whether people reach the reviews and the detailed product description
- By device: on mobile, whether the add-to-cart button is on the first screen and in an easy-to-tap position
Information that is clicked often (such as shipping and return conditions) is likely information visitors want to confirm before buying. You can consider improvements such as putting it on the product page itself instead of behind a link.
Articles and Columns
The purpose of an article page is to get it read and to lead people to the next action (a related article, a request for materials, or a product page).
- Scroll: around which heading drop-off increases, and what share of people reach the end of the article
- Attention: which paragraphs are read closely and which are skipped
- Click: whether links and buttons in the article are being clicked, and which items in the table of contents are clicked
Items in the table of contents that are clicked often are topics readers are highly interested in. You can decide to move that topic to the first half of the article or write about it in more detail as a separate article. If you learn that a call to action that appears only at the end of the article is hardly seen by most people, you can consider placing one in the middle of the article too.
Forms (Inquiries and Sign-ups)
A form is the page right before a result, and a place where small improvements are likely to translate into results.
- Scroll: whether people reach the bottom of the form (the submit button)
- Click: how far into the input fields people interact, and whether explanations or notes that aren't input fields are being clicked
- By device: whether input fields or options are hard to tap on mobile
However, all a heatmap shows is "how far people interacted." If you want to know in detail how long each field takes to fill in or which field people give up on, a tool with a dedicated form analysis feature is a better fit. Also, since a form is where people enter personal information, you should choose tools and settings that don't record the content that is entered (see "Personal Information and Privacy Considerations" below).
Sites Where Heatmaps Fit and Sites That Need Care
Heatmaps are useful on most websites, but how well they work and what to watch out for vary with the nature of the site.
They fit sites that have clearly defined pages tied to results, and a certain amount of traffic to those pages. Examples include LPs that run ads, product pages, and pages for requesting materials or making inquiries. Once you find where to fix, it's easy to check the impact on results.
On the other hand, in the following cases you need to be careful about how you read them:
- Sites with few visits: it takes time to accumulate data. Use a longer collection period and focus on pages with more visits
- Sites with a very large number of pages: looking at every page isn't realistic. For pages of the same type (template), such as product pages or article pages, picking a few representative pages with high visits will reveal problems with the template itself
- Pages whose display varies a lot from person to person: on pages whose content changes per member, or on sites where the screen is rewritten without switching pages (SPAs), the screen that gets the color overlay and the actual display tend to drift apart. Check before adoption whether the tool supports that kind of build
- Pages that require login: some tools can't capture the screen automatically. Check whether you can supply a screen image separately
In every case, the shared approach is not to try to look at every page but to start with the pages closest to results.
How to Choose a Heatmap Tool
There are many heatmap tools, and comparing feature lists alone makes it hard to decide. Checking five points that tend to cause trouble later helps you narrow down the tool that fits your company.
- Free tier and pricing: what you can use for free, and how paid plans are priced
- Data retention: how far back you can look at past heatmaps
- Data export: whether you can take aggregated results or raw data out of the dashboard
- Impact on page speed: the size of the tracking tag and how it loads
- Privacy: use of cookies, how input content is handled, and where data is stored
Comparing the number of features is fine once you've covered these five. A tool with many features you won't use can end up being a burden in price and page speed. Let's go through them in order.
Free Tier and Pricing
Several tools let you start for free, but what you can use for free varies greatly from tool to tool. Some have a cap on visits, some track only one page, and some have no limits. If you know your site's monthly visits and the number of pages you want to look at, you can judge whether the free tier is enough.
For paid plans, some tools publish their pricing and others require you to contact them for a quote. Also check whether pricing is usage-based, scaling with visits, or a flat rate.
Data Retention
A heatmap is most powerful when you compare before and after a change. If the retention period is short, the data won't be there when you want to compare against a design from a few months ago. If you want to see seasonal differences, whether data from a year ago is kept is also a factor.
Data Export
Whether you can take heatmap data out of the tool's dashboard is easy to overlook at adoption time. If you can, it becomes easier to combine it with sales data for analysis, ask AI to analyze it, and switch tools in the future. Whether you can export only aggregated results or the raw data as well also differs from tool to tool.
Impact on Page Speed
The tracking tag is a program loaded in the visitor's browser. Its effect on page speed depends on the size of the tag and how it loads. On sites that already have several measurement tools installed, measuring and comparing page speed before and after adding a new one gives you peace of mind.
Privacy
Because a heatmap records visitor behavior, privacy considerations are essential. Check the tool's official documentation for whether it uses cookies, whether it avoids recording the content of input fields, and in which country the data is stored. We cover this in more detail in "Personal Information and Privacy Considerations" below.
Where the Main Heatmap Tools Stand
Here is a brief introduction to representative tools, focused only on how they are positioned. The following is based on what we confirmed on each company's official site in July 2026 as comparison data for this site. Pricing and features can change, so please check each company's official site for the latest information before adopting a tool.
- Microsoft Clarity: a free tool with no cap on visits. In addition to heatmaps, it offers session replay
- Hotjar: offers heatmaps, session replay, and surveys, and is widely used by marketers. A free plan is available
- Mieruca Heatmap: a tool widely used in Japan. It offers support in Japanese, and you can try it from a free account (1 URL). Paid plans are quote-based
- Ptengine: an analytics tool that includes heatmaps. A free plan is available
- HeatMapX: the tool provided by this site. Click, scroll, and mouse movement heatmaps are available from the free plan
Every tool has strengths and weaknesses, and which is best depends on the size and purpose of your site. The shortcut is to decide your own requirements first, such as whether you need session replay, support in Japanese, or the ability to take data out, and then compare.
For a detailed comparison of features and pricing, see Heatmap Tools Compared.
How to Set Up a Heatmap
For most tools, setting up a heatmap comes down to three stages: "sign up, add the tracking tag, and wait for data to accumulate." The only hard part is "where to put the tag," and the method depends on how your site is built.
The Basics: Add One Line of Tracking Code
When you sign up for a tool, the dashboard shows you a tracking tag. For most tools, it's a short single line. Paste it inside the head element (just before </head>) of every page you want to track.
If you can edit your site's HTML directly, pasting it once in the shared header section applies it to all pages. If you can't edit it, or you use a site-building service, use one of the methods below.
Using Google Tag Manager (GTM)
If your site already manages tags with GTM, delivering the tag from GTM is the tidiest method. Paste the tracking tag into a "Custom HTML" tag, set a trigger that fires on all pages, and publish. You don't have to touch the site's code, and it's easy to remove later.
A concrete walkthrough using HeatMapX as the example is in How to Install a Heatmap with GTM.
Adding It to WordPress
In WordPress, you can use the tag insertion field in the theme settings, use a plugin for inserting code, or edit a child theme's files. If it's your first time, using the theme settings field or a plugin, which doesn't require touching code, is the safer approach.
The steps are summarized in How to Install a Heatmap on WordPress.
Adding It to Shopify
In Shopify, the common approach is to paste the tracking tag into the theme code (theme.liquid). Before editing, duplicate your theme to make a backup. Note that the payment pages (checkout) don't run the theme's code, so they are outside the scope of tracking with this method.
The steps are explained in How to Install a Heatmap on Shopify.
What to Check After Setup
After adding the tag, check these three points:
- Is tracking running? Browse a few pages of your site yourself and see whether the visit count in the dashboard goes up
- Is the tag on every page? Check that tracking works not just on the home page but also on the pages you want to look at, such as LPs and forms
- How it interacts with consent management tools: if you use something like a cookie consent banner, check that the consent settings aren't blocking the tag from being delivered
Personal Information and Privacy Considerations
A heatmap is a mechanism that records visitor behavior. Whoever sets it up is responsible for understanding what is recorded and how it is handled, and for being able to explain it to visitors. Here are five points to check.
Don't Record Input Content
Check that names, email addresses, passwords, credit card numbers, and other information entered into forms is not recorded. Many tools have a mechanism that doesn't record input content or masks it, but whether the default settings are sufficient needs to be confirmed in the tool's official documentation. For tools with session replay, also pay attention to how personal information that appears on screen (such as names and addresses on a member page) is handled.
Know What Is Used to Identify Visitors
To group the behavior of the same visitor, tools use cookies or identifiers stored in the browser. Some tools don't use cookies, but even then it is common for them to tell visits apart with some kind of anonymous identifier. Make sure you understand which mechanism is used and how long the identifier persists.
Describe It in Your Privacy Policy
State the name of the tool you use, the information it collects, and the purpose of use in your privacy policy or a similar document. In Japan, under the "external transmission rule" of the amended Telecommunications Business Act that took effect in June 2023, covered businesses are required to notify or publicly disclose when they send visitor information to outside parties. Check publicly available materials from the Ministry of Internal Affairs and Communications, or consult a specialist, to find out whether your company is covered and what needs to be stated.
If You Have Visitors from Overseas
For sites with visitors from the EU, you may need to comply with regional regulations such as the GDPR (the EU General Data Protection Regulation). Check whether the tool can work with a mechanism that starts tracking only after consent is obtained (a consent management tool), and in which country the data is stored.
Decide How It Will Be Handled Internally
Decide in advance who can view heatmap data and how you'll manage accounts for former employees and outside partners. This is an area where problems tend to arise as an issue of operations rather than tool features.
Note that the points above are an organized list of things to check, and they do not guarantee compliance with any law. Regulations vary by region, industry, and time, so consult a specialist if you are unsure.
Getting Started with HeatMapX
Finally, here is a brief introduction to HeatMapX, the tool this site provides, limited to facts related to heatmaps (as of November 2026).
$0 Monthly price of the Free plan (no credit card required)
5,000 Sessions you can track on the Free plan (per month, 1 site)
About 7KB Size of the tracking tag (compressed)
- Heatmaps available: three types, click, scroll, and mouse movement. You can switch between desktop and mobile views and filter by device type
- Setup: add one line of tracking code. GTM, WordPress, Shopify, and others are also supported
- Privacy: the tracking tag doesn't use cookies and doesn't collect information that can identify an individual, such as names or email addresses. What it stores are click positions, scroll depth, and a randomly generated anonymous ID
- Pricing: flat-rate plans: Free ($0) / Lite ($12 per month) / Plus ($29 per month) / Pro ($99 per month). The heatmap features are the same on every plan. What changes is the number of sites you can register and the number of visits you can track per month
- Analysis with AI: you can connect to an AI such as Claude and have it read the aggregated heatmap data
We also want to be upfront about the uses it isn't suited for. HeatMapX does not have session replay (recordings of visitors' actions) or surveys. Also, what you can take out is aggregated data, and there is no feature to export the raw data as is. If you want to replay each person's actions to check them, another tool that offers session replay is a better fit.
For details on each plan, see the pricing page.
Frequently Asked Questions (FAQ)
What is a heatmap, in simple terms?
It is a method that aggregates the behavior of people who visit a web page (clicks, scrolling, reading, and mouse movement) and overlays it on the page in shades of color. Places with a lot of activity are generally shown in warm colors such as red, and places with little in cool colors such as blue, so you can spot likely problem areas at a glance without reading a table of numbers.
What is an attention heatmap?
It is a heatmap that shows in color which parts of the page were displayed on screen, and for how long. It is sometimes called a "reading area" map. Areas that stayed on screen for a long time because people stopped scrolling turn redder, so it gives you clues for telling apart content that is read closely from content that is skipped. Keep in mind that it does not measure the gaze itself.
Can I use a heatmap for free?
Yes. There are several tools that are free to use or that offer a free plan. However, what you can use for free (the cap on visits, the number of pages you can track, the data retention period, and so on) differs greatly from tool to tool. The differences are summarized in Heatmap Tools Compared.
If I have GA4, do I still need a heatmap?
Because they play different roles, we recommend using them together. GA4 is a tool for understanding site-wide trends in numbers, such as "which pages have a lot of drop-off" and "which traffic sources perform best." A heatmap is a tool for seeing on screen what is happening where on that page. If you use GA4 to decide which page to fix and the heatmap to decide where to fix, they make up for each other's weaknesses.
How much data do I need before I can start analyzing?
It depends on the page and the goal, so there is no single standard. As a rule of thumb, once the color trends stop changing much when you extend the collection period, it is probably fine to start reading. Pages with few visits change color because of just a few people's behavior, so it is practical to take a longer period or to look at pages with more visits first.
Will adding a heatmap slow down my site?
Because a tracking tag has to be loaded, we can't say it has no effect at all. How much it matters depends on the size of the tag and how it loads. Choose a tool that loads in a way that doesn't block page rendering, and measure and compare page speed before and after adding it for peace of mind. If you use several measurement tools together, check the combined effect as well.
Summary
A heatmap is a method that visualizes the behavior of people visiting a web page as shades of color, making it visible what is happening inside the page. Where web analytics tells you "which page," a heatmap adds "where on the page."
Here are the key points of this article:
- There are four types: click (where it was clicked), scroll (how far it was read), attention (where it was read closely), and mouse movement (where interest was directed)
- Use it in order with web analytics: use web analytics to decide which page to fix, and the heatmap to decide where to fix
- Don't judge by color alone: match data volume, device, traffic source, and period, and read each spot against its role
- Verify what you find: check hypotheses formed from heatmaps by comparing before and after a change or with an A/B test
- Choose a tool using five points: free tier and pricing, retention period, data export, impact on page speed, and privacy
- Privacy considerations are the responsibility of the site owner: understand what is being recorded and be ready to explain it to visitors
As a next step, pick one page with a lot of visits, install a heatmap tool, and use the scroll heatmap to check "what share of people reach the important information." The gap you find there becomes your first improvement hypothesis.
To learn how to verify the problems you find, see also Heatmap vs. A/B Test: Differences and How to Use Each.